This is an individual project done to research and model the Singaporean HDB Resale Market using R, attaining A grade. 🏢
The Project
In this project, I used methods such as regression, clustering and PCA, etc. to model and predict the HDB resale prices, given a set of parameters for the resale unit.
Firstly, data from data.gov.sg was cleaned and prepared for analysis. Some summary statistics was produced so that I can have a better understanding of the data.
Example:
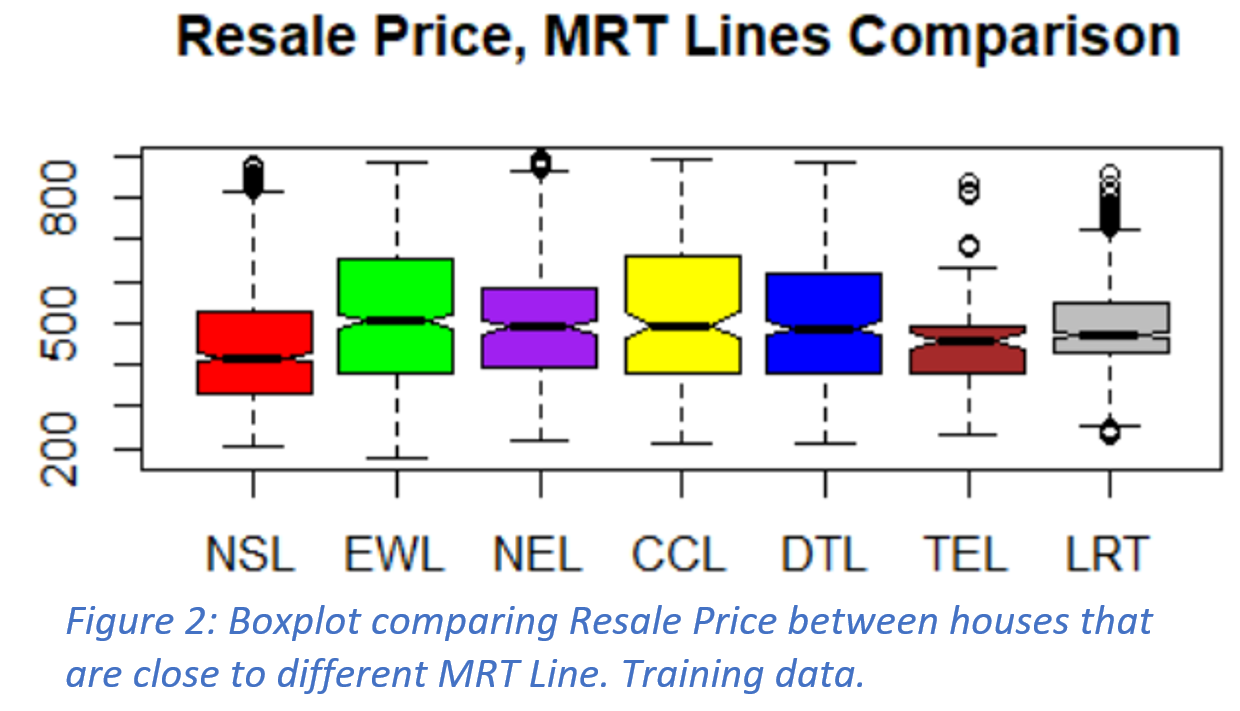
This visualization gave me an interesting result. The boxplot notch of NSL does not overlap with notches of every other line, telling us that it is highly like that its median price differs from the rest, which are not significantly different. This could be due to NSL tend to be far from the CBD. The max value of TEL is also significantly lower than the rest, possibly due to the smaller sample size because TEL is relatively new and less developed.
Secondly, I produced a linear model as a benchmark by using a decision tree to check for useful predictors and cross-validation to decide on the degree of polynomial I use as my regression model.
Next, I use some unsupervised learning methods such as Hierarchical clustering and K-means Clustering. Allowing us to get more insights to our data.
For example, Both Methods produce 4 groups. K-means Clustering(Right graph above) shows that HDBs with small floor area tend to have low resale price(blue). There is also a group in the middle of the plot(green). These could be the average HDB. Those with high floor area generally have higher resale prices(purple), but some have lower resale prices that is near the median value. There is also a group with high resale price without as much floor area(red). This could be due to red being in prime locations such as being very near CBD while purple may be in non-mature/less desired locations.
Thirdly, I explore the use of Decision Trees, KNN, PCA and NB to compared them to our benchmark model using MSE metric. Classification methods like NB was compared with a confusion martix. Results were documented and a succint report was produced. You may click here to download a pdf copy.
Thanks for reading!
After this project, I have done many projects such as visualization with ggplot2 and Tableau! Click here to find out more!